
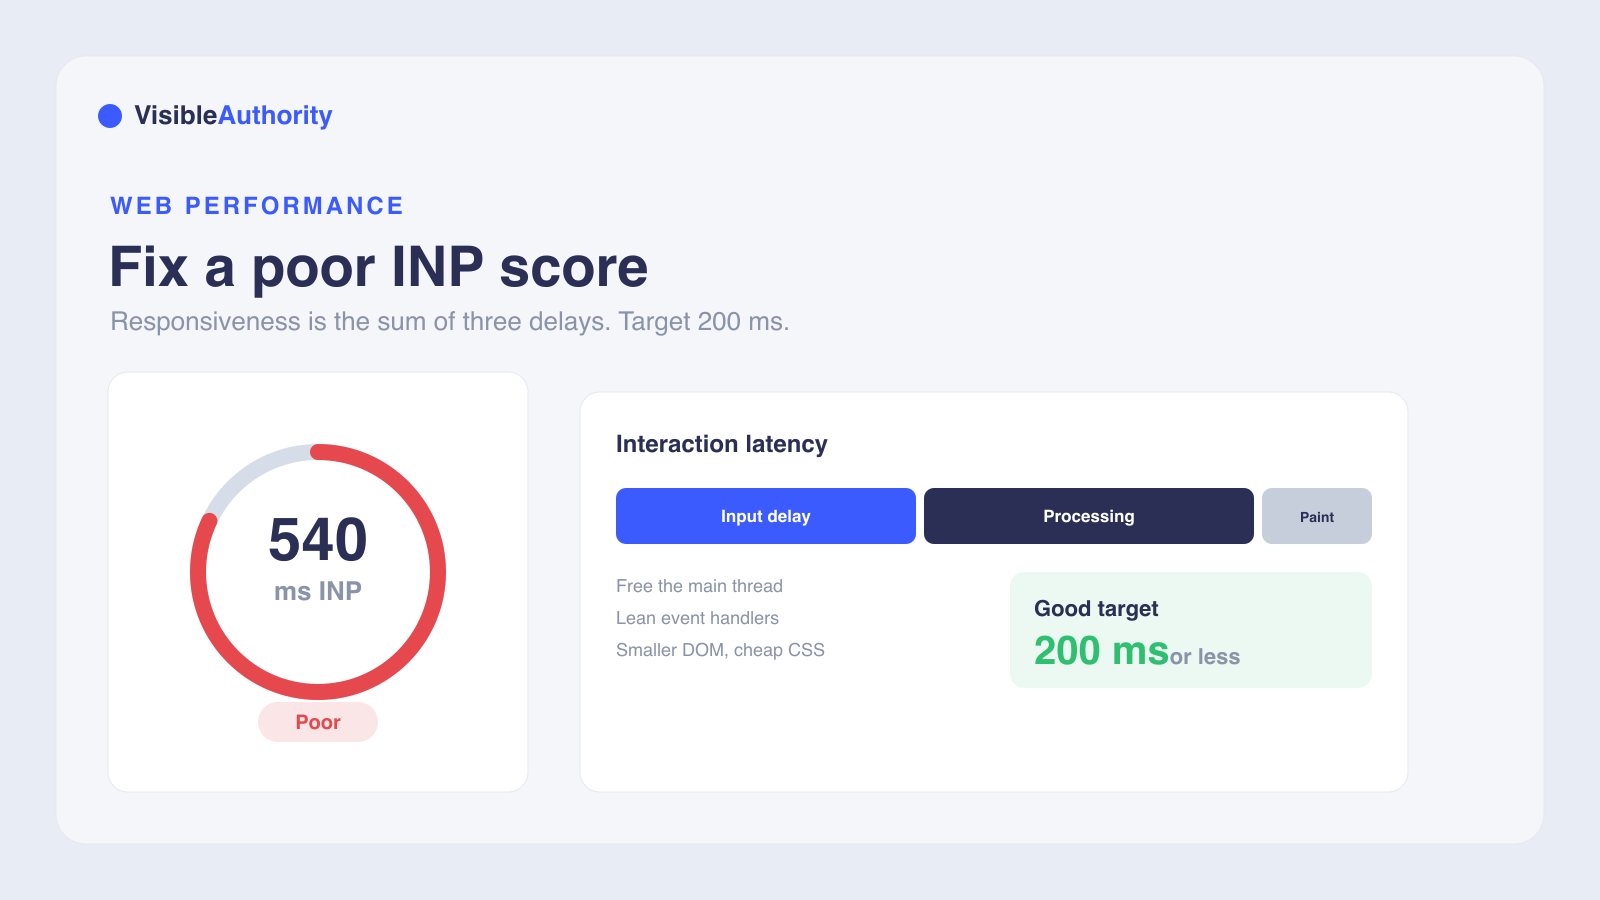
Interaction to Next Paint (INP) is a Core Web Vital that measures how quickly a page responds visually to user input, reporting the latency of the worst click, tap, or keypress during a visit at the 75th percentile. Good is 200 milliseconds or less, needs improvement is over 200 up to 500 milliseconds, and poor is above 500 milliseconds. Every interaction's latency is the sum of input delay, processing time, and presentation delay, so fix it by freeing up the main thread (break up long JavaScript tasks and defer non-critical scripts), writing lean event handlers, and painting the next frame faster (smaller DOM, compositor-friendly CSS). Diagnose with field data in Search Console and PageSpeed Insights first, then confirm in a Chrome DevTools trace.
You opened Search Console or PageSpeed Insights and found a red flag next to INP. Now you need to understand what that metric measures and fix it. This guide covers what Interaction to Next Paint (INP) measures, how Google calculates it, and how to move your score from poor to good.
What is Interaction to Next Paint (INP)?
Interaction to Next Paint (INP) is a Core Web Vital that measures how quickly a page responds visually to user input. It reports the latency of the worst qualifying interaction during a visit, so a low score means the page consistently responds fast.
An interaction is a click, tap, or keypress on a physical or onscreen keyboard. Hovering, scrolling, and zooming are not observed. The next paint is when the browser paints a frame showing visual feedback, like a menu opening or a cart confirmation. INP does not wait for network fetches or async updates.
For most sites, the worst interaction's latency becomes the reported value. When a page has many interactions, Google ignores the single highest latency for every 50 interactions to filter random hiccups. The final score is the 75th percentile across page views, calculated using the Event Timing API and finalized when the user leaves the page.
Why INP matters for user experience and SEO
Chrome's web.dev guidance notes that about 90% of a user's time on a page is spent after it loads. That is why responsiveness throughout a visit matters more than load time alone. A page that feels sluggish on tap or click erodes trust, and slow responsiveness correlates with higher bounce rates and lost conversions.
Google replaced First Input Delay (FID) with INP on March 12, 2024. FID only measured the first interaction's input delay. INP observes all interactions across the full visit, measuring the full duration from input through handler execution to the next visual paint.
Core Web Vitals feed Google's page experience signal. INP rarely moves rankings alone, but it compounds with other signals and directly affects user behavior. Google recommends achieving good Core Web Vitals for success in Search.
The same page-quality signals that Google's ranking systems read are increasingly what AI answer engines weigh when deciding which sites to cite and recommend to buyers.
INP score thresholds: what counts as good, needs improvement, or poor
Google groups INP scores into three ranges. Good is 200 milliseconds or less. Needs improvement is above 200ms up to 500ms. A poor INP score is anything above 500ms.
The pass criterion is the 75th percentile of page loads. A page whose 75th percentile sits at 250ms is failing, even if the median experience feels fast. Google assesses mobile and desktop separately, and Search Console groups URLs by similar performance rather than reporting every URL individually.
INP sits alongside two other Core Web Vitals: Largest Contentful Paint (LCP) for loading and Cumulative Layout Shift (CLS) for visual stability. Here is how all three compare:
| Metric | Good | Needs improvement | Poor |
|---|---|---|---|
| INP (responsiveness) | 200ms or less | Over 200ms to 500ms | Over 500ms |
| LCP (loading) | 2.5s or less | Over 2.5s to 4s | Over 4s |
| CLS (visual stability) | 0.1 or less | Over 0.1 to 0.25 | Over 0.25 |
How to diagnose a poor INP score
Start with field data, not lab data. Check Search Console's Core Web Vitals report to see which URL groups are failing INP, then use PageSpeed Insights for CrUX field data per URL. CrUX gives you the INP value but little context about which interaction was slow. Real User Monitoring (RUM) tools add that context: the interaction type, the element involved, and when it happened.
Once field data flags a problem, move to the lab. Open Chrome DevTools' Performance panel, start a trace, and interact with the page during load, when the main thread is busiest. In Lighthouse, Total Blocking Time (TBT) is the best lab proxy for INP when field data is sparse.
The mental model that makes diagnosis possible is that every interaction's latency is the sum of input delay, processing time, and presentation delay. Each part has different fixes. A page can pass lab tests while failing field data; when the two disagree, trust field data because it reflects what real users experience.
Fix input delay: free up the main thread
Input delay is the gap between the user's gesture and the moment event handlers start running. It is long when the main thread is busy: long JavaScript tasks, scripts loading and parsing, timer functions, fetch handling, or overlapping interactions competing for the thread.
The most direct fix is breaking up long tasks. Split a long function into smaller chunks using setTimeout so no single task blocks the thread for long. Each browsing context, including iframes, has its own main thread, and slow interactions inside iframes count toward the page's INP.
Deferring non-critical JavaScript keeps the main thread free when users interact. For heavy computation that does not need DOM access, move it off the thread with Web Workers. For finer control, use scheduler.yield() to yield mid-task, requestIdleCallback() to defer work to idle periods, and requestAnimationFrame() to align work with frames.
Fix processing time: write efficient event handlers
Processing time is how long event callbacks take to run to completion. Slow handlers are a direct INP cost. Do as little work as possible inside event callbacks, and move anything not needed for the immediate visual response into a later task.
For high-frequency events like scroll-linked or input-driven callbacks, use debouncing and throttling so handlers fire less often. Debouncing delays execution until activity stops; throttling limits it to a fixed interval.
Avoid layout thrashing: reading style values right after writing styles forces synchronous layout work. Read values first, then write. When deferring non-critical logic, the setTimeout inside requestAnimationFrame pattern works in all browsers: the visual update runs in the animation frame, and everything else is deferred to a new task.
Fix presentation delay: paint the next frame faster
Presentation delay is the time between event handlers finishing and the browser painting the next frame showing the result of the interaction. Even small amounts of callback code can produce expensive rendering work.
DOM size is a major factor. When a DOM is small, rendering finishes quickly. When DOMs get very large, rendering work scales with size, making every visual update more expensive. The CSS content-visibility property helps by lazily rendering elements as they approach the viewport, cutting both initial render work and per-interaction cost.
Keep rendering efficient. Avoid forcing synchronous layout, keep CSS selectors cheap, and prefer compositor-friendly properties like transform and opacity for state changes. Third-party scripts and embeds often add hidden rendering work, so audit them as part of the fix.
Tools for measuring and monitoring INP
Field data tools reflect what Google measures. Search Console's Core Web Vitals report shows which URL groups are failing. PageSpeed Insights surfaces CrUX field data per URL alongside lab results. The CrUX dataset provides raw access for teams who need it.
Lab tools are for debugging. Chrome DevTools' Performance panel traces specific interactions, and the Event Timing API attributes slow ones to elements. In Lighthouse, Total Blocking Time is the best INP proxy for low-traffic pages where field data is sparse.
RUM providers add interaction-level context that CrUX does not: the element, the interaction type, and timing breakdowns. If your team uses a RUM tool, ask about INP support. Keep web.dev's INP and Optimize INP documentation bookmarked as the canonical reference.
Verify your fixes and keep INP healthy
After deploying fixes, re-check field data in Search Console and PageSpeed Insights. CrUX data is aggregated over a rolling 28-day window, so improvements take time to surface. For faster feedback, re-run a lab trace in Chrome DevTools to confirm the slow interaction now paints quickly.
Fixing INP is iterative. Resolving one slow interaction often reveals the next-worst one, especially on highly interactive pages. Watch the Search Console Core Web Vitals report monthly and alert on regressions after new scripts, features, or third-party tags ship.
A fast, responsive page is the foundation. The next layer is making sure AI answer engines surface your brand when buyers ask questions. See why ChatGPT recommends competitors and how to fix it, or start a 30-Day Visibility Sprint: mapping across major models, answer-first content deployment, and prompt testing for measurable gains in AI mention rates within 30 days.
These are the questions buyers and developers ask most often about INP.
INP questions, answered
What is a good INP score?
What causes a poor INP score?
Does INP affect SEO rankings?
How is INP different from First Input Delay (FID)?
How long does it take for INP fixes to show in Search Console?
An AI visibility assessment shows where your brand stands across ChatGPT, Perplexity, Gemini, and Claude when buyers ask questions.
We'll run your category through the major models and map exactly where you appear, where competitors win, and what it takes to become the recommendation.